Statistics and tracking links
2 min read · updated 30 September 2026
Want to know if your promotion works? The statistics show you how often your profile and your events are viewed. With tracking links you can also see which channel people came from.
1Your profile statistics
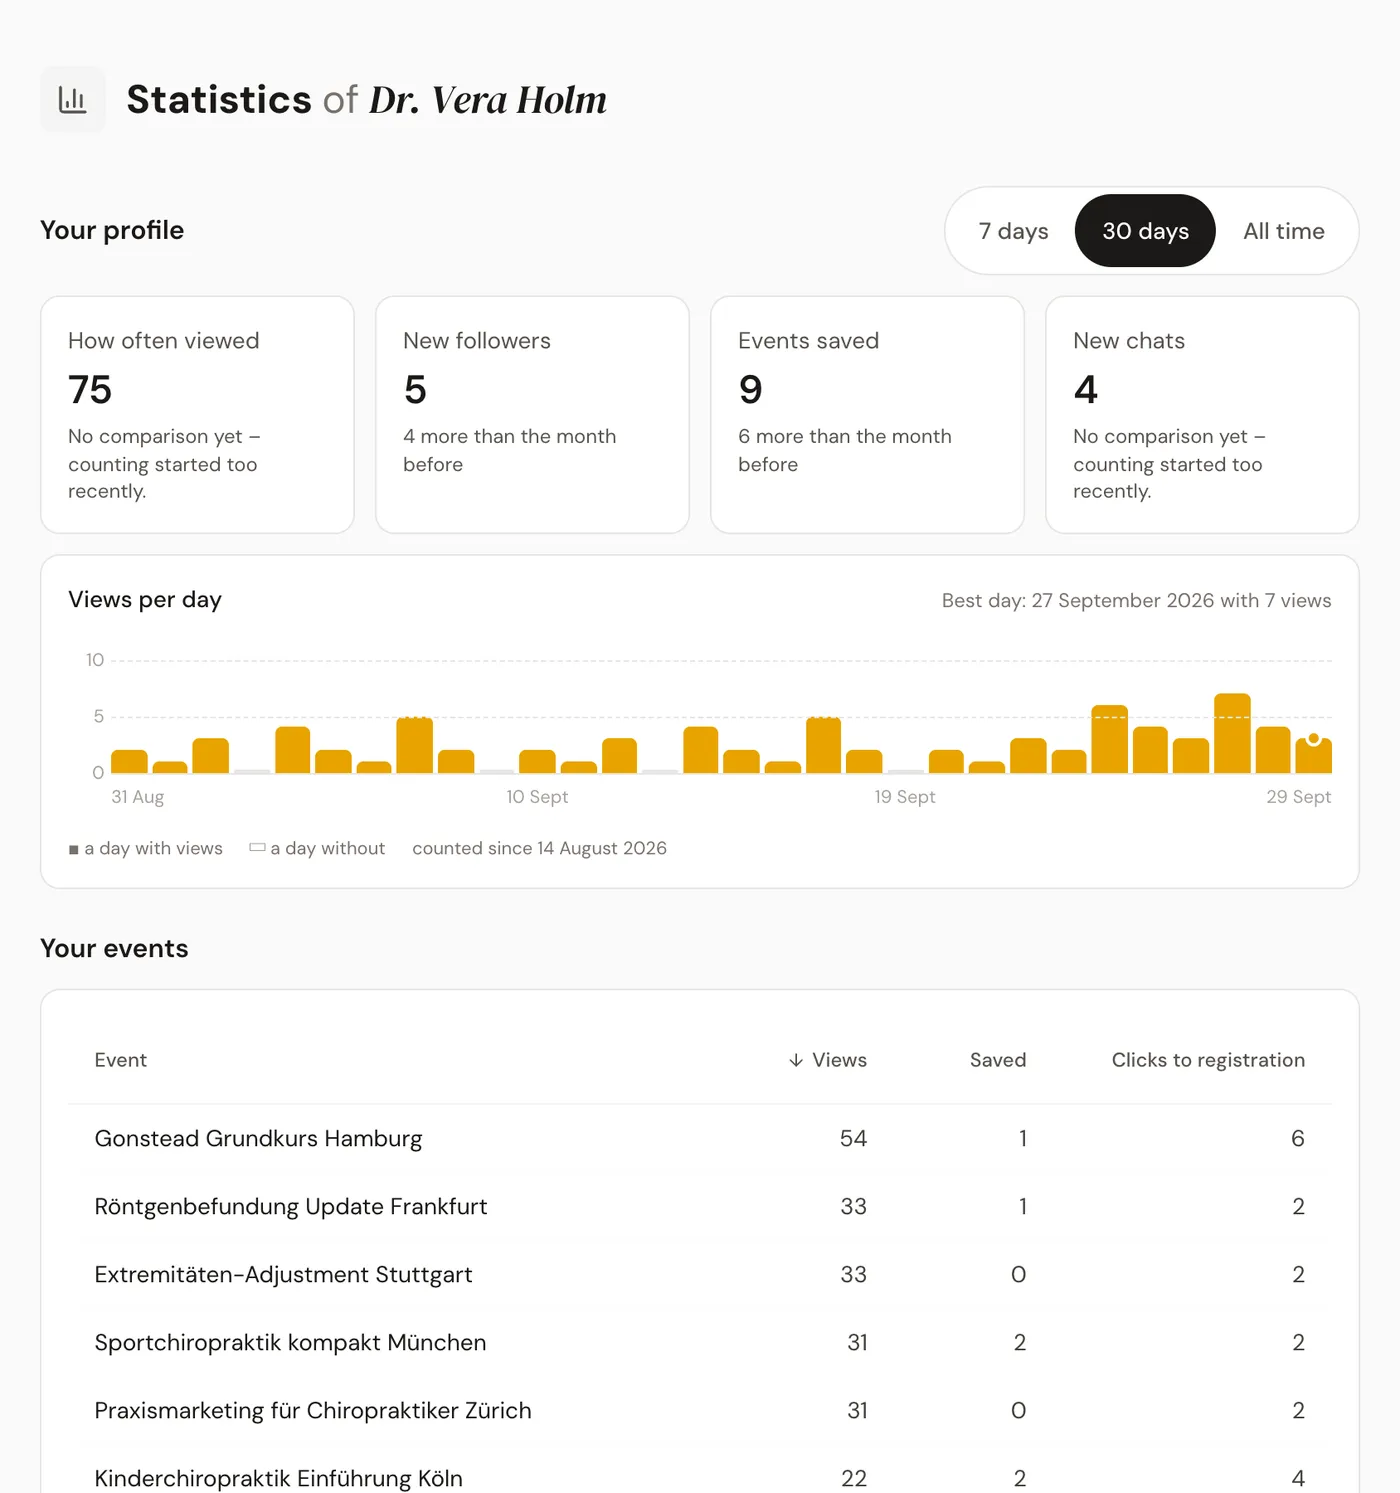
In the dashboard, open your profile and then Statistics. At the top right, choose the Timeframe: 7 days, 30 days or All time.
Under Your profile you see four numbers: How often viewed, New followers, Events saved and New chats. Below that, a short text tells you how it compares to the previous week or month, and a chart shows the Views per day.
Under Your events you see Views, Saved and Clicks to registration for each event. These are clicks on the registration button, not confirmed registrations. Clicking a column sorts the table.
2The numbers of an event
On the events page, click an event. Under Marketing and statistics you see three tiles: Statistics, Marketing templates and Tracking links. Behind Statistics you find views, Registration clicks, how often the event was saved, the Guest list and the trend per day. Counting starts at publication.
3Create tracking links
A tracking link is a separate address for your event, one for each channel. We create the Main link automatically for every event. You create more like this:
- 1In your event overview, open the Tracking links tile.
- 2Under Create a new link, choose the Channel, for example Instagram story, WhatsApp or print.
- 3Under Label, just for you, enter something you will recognize, such as "Newsletter October", and click Create.
- 4With the Copy address icon you copy the new link. With QR code you get it as an image to print, as PNG or SVG.
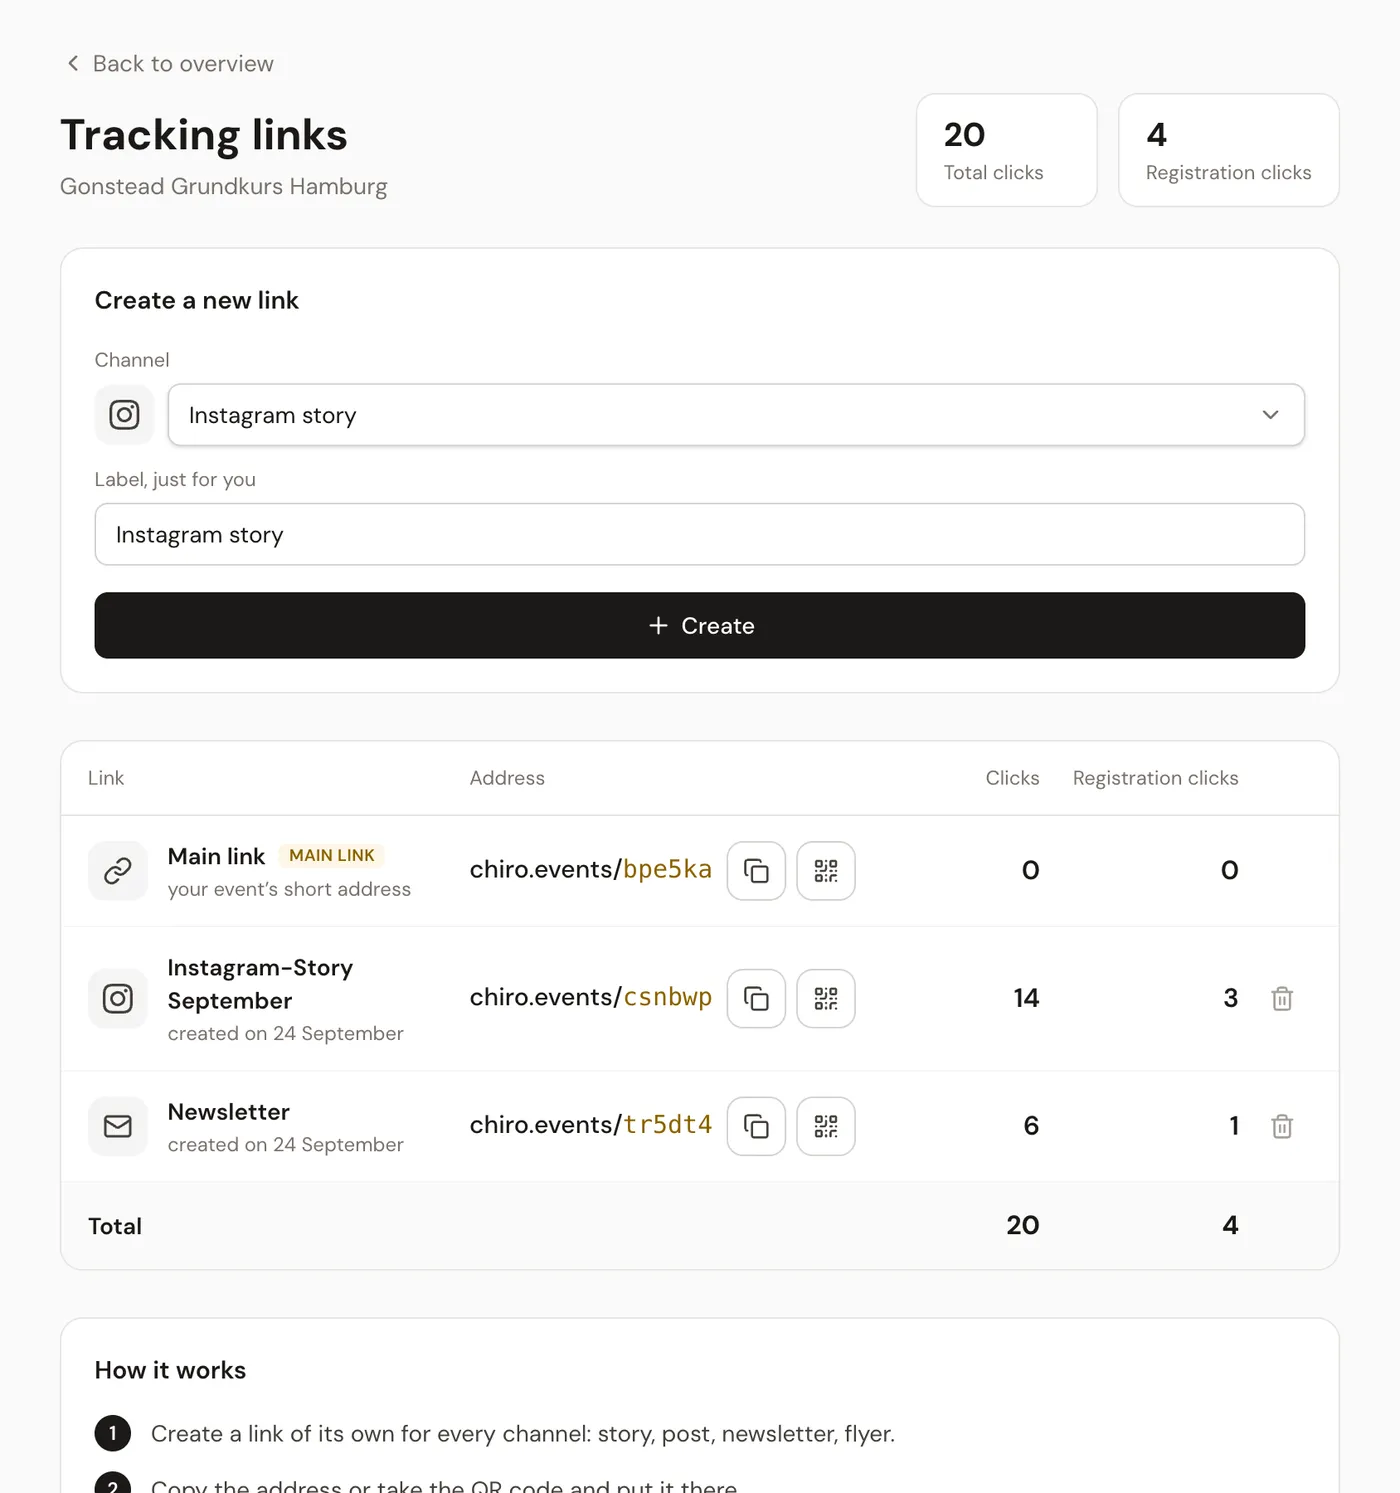
In the list you see the Clicks and the Registration clicks for each link. That way you know whether the story or the flyer brought more. Each visitor counts once per day.